How full are home-service schedules?
Owners reported a wide range of booking capacity. These survey categories describe their businesses at the time they answered.
U.S. owner survey; December 2025; n=1,050. Self-reported capacity.
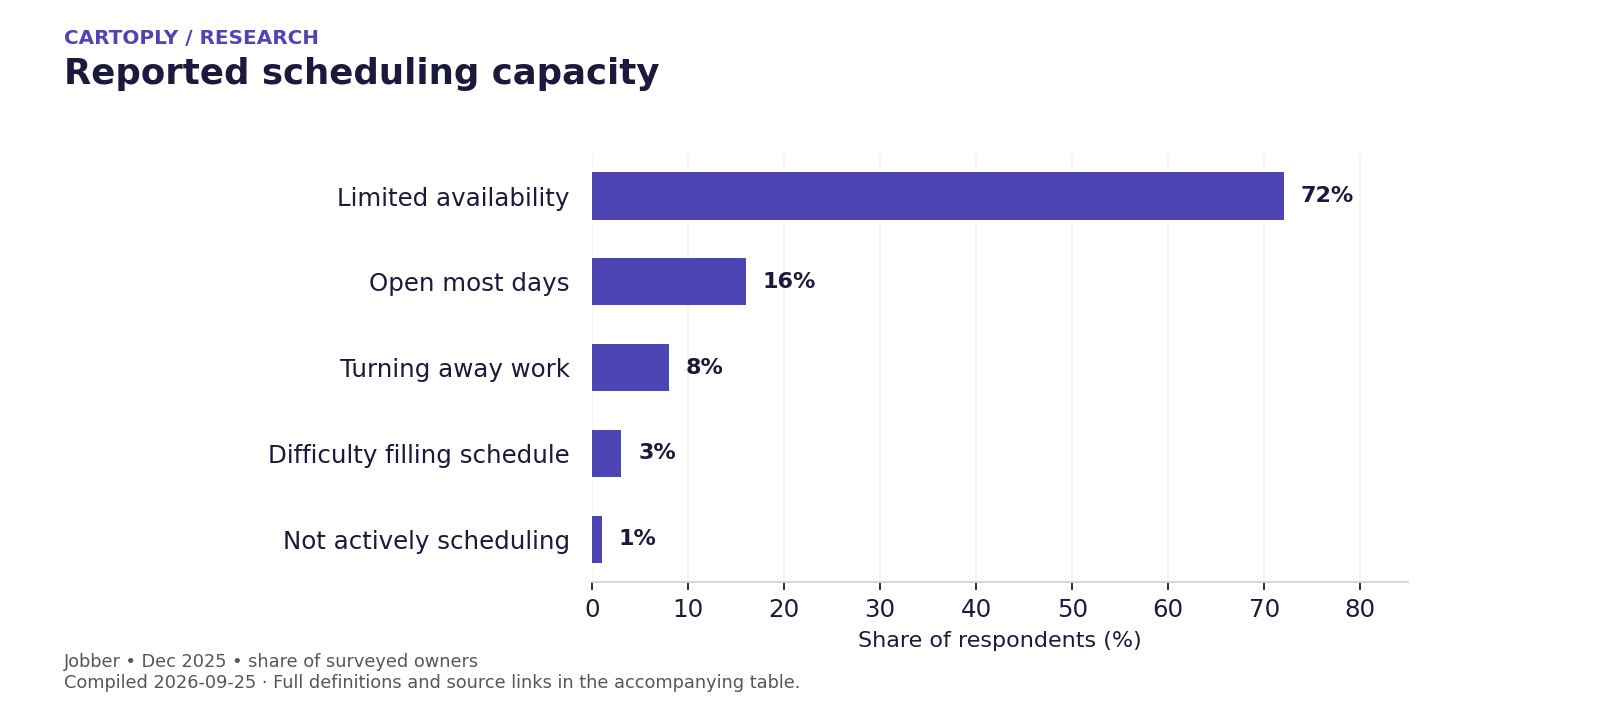
| Measure / group | Figure | Period / original source |
|---|---|---|
| Limited availability # | 72% | Dec 2025 survey Jobber |
| Open most days # | 16% | Dec 2025 survey Jobber |
| Turning away work # | 8% | Dec 2025 survey Jobber |
| Difficulty filling schedule # | 3% | Dec 2025 survey Jobber |
| Not actively scheduling # | 1% | Dec 2025 survey Jobber |
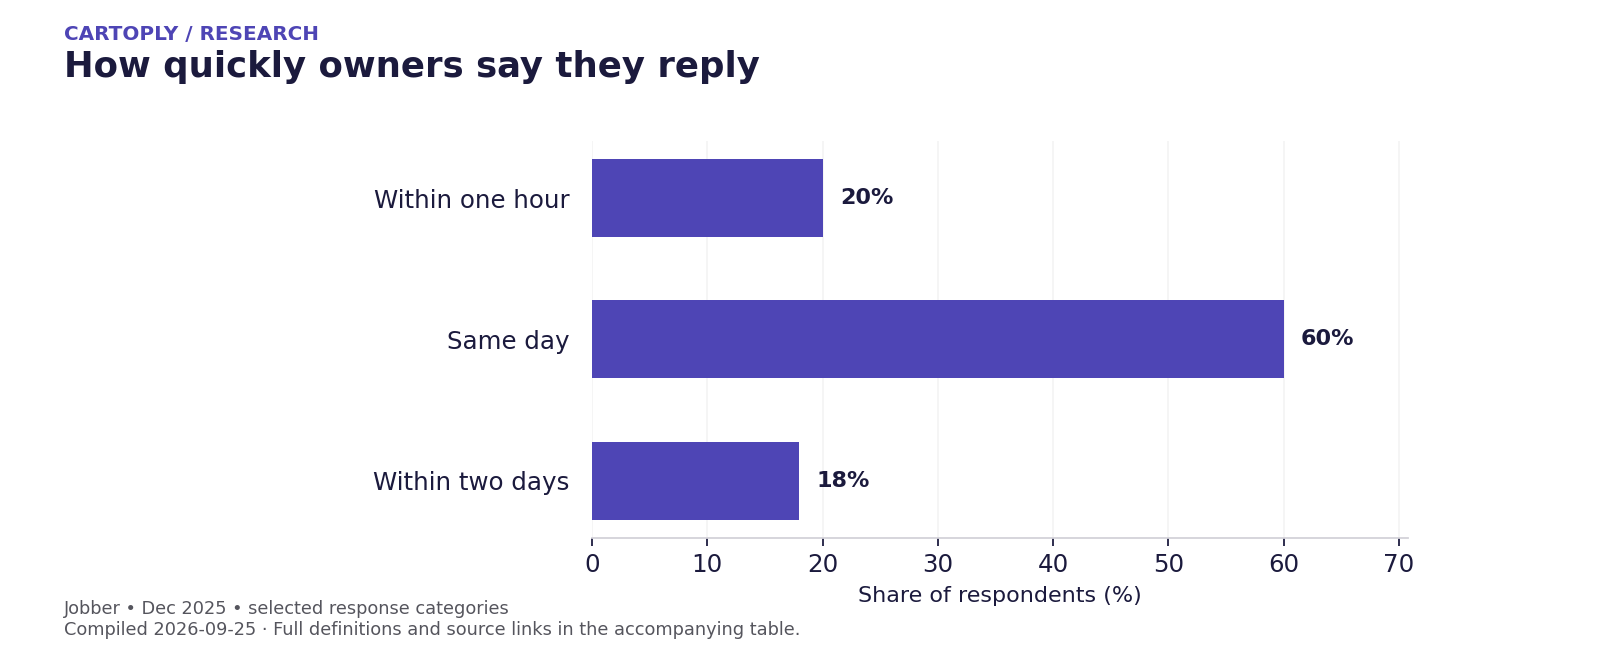
Reported lead response times
The survey separates “within an hour” from “same day.” Those are the publisher’s response categories; the same-day figure should not be read as a cumulative total.
U.S. owner survey; December 2025; n=1,050. Selected published response categories.
Recent homebuyers: hiring and follow-up
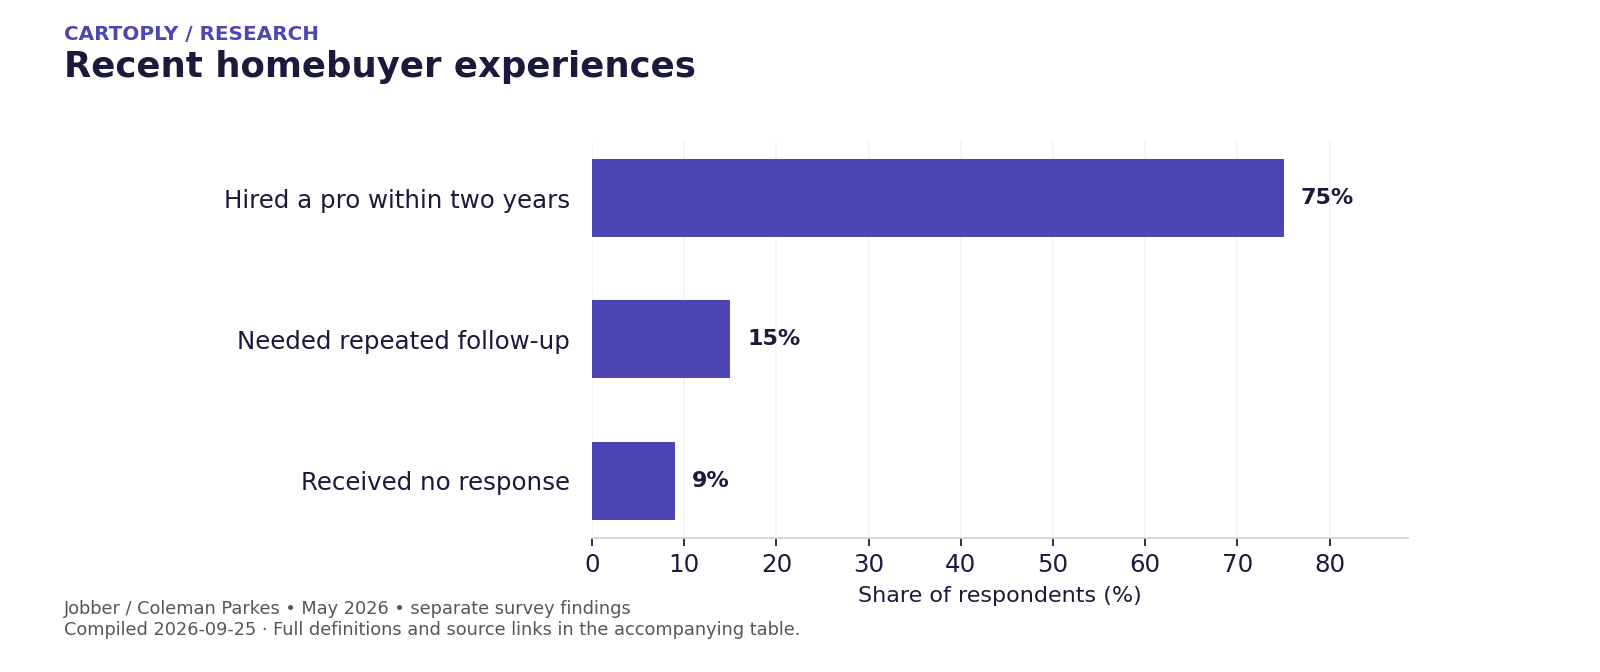
The recent-homebuyer study covers a specific audience: people who bought a single-family home in the preceding two years. It is not a survey of every homeowner.
U.S. survey commissioned by Jobber, May 2026; n=800; equal generation groups.
How should a contractor make first contact?
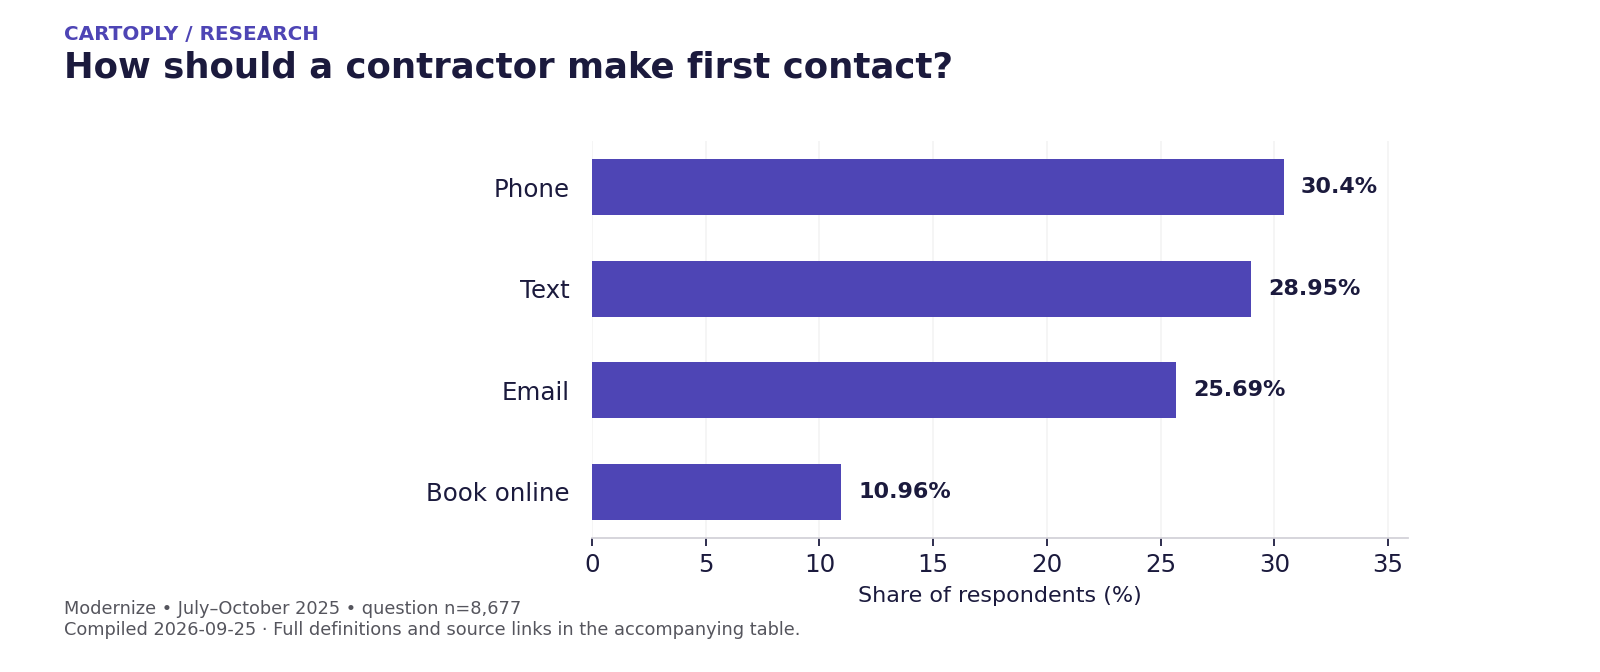
Modernize asked how a contractor should initially reach out when someone is booking a home-improvement project. That is a different question from how someone prefers to select an appointment time.
Homeowners answering an initial contractor-contact question. Modernize 2025 report; n=8,677. Fieldwork: July–October 2025. Published categories sum to 96%; no normalization or missing category inferred.
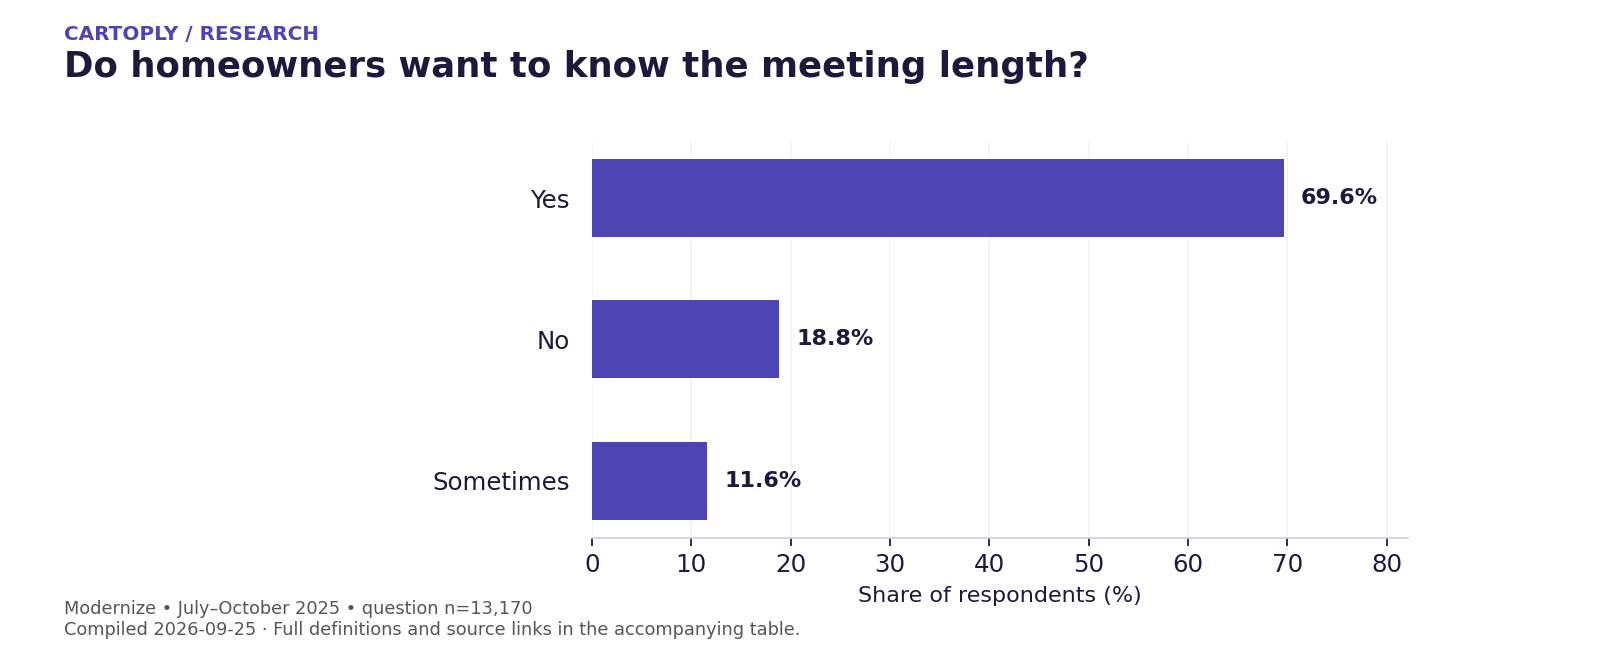
Do homeowners want to know the meeting length?
A clear appointment length sets expectations before the first meeting. This question measures whether respondents want that information, not how long appointments should last.
Homeowners answering whether they want to know the first meeting’s duration. Modernize 2025 report; n=13,170. Fieldwork: July–October 2025.
Home-service booking preferences
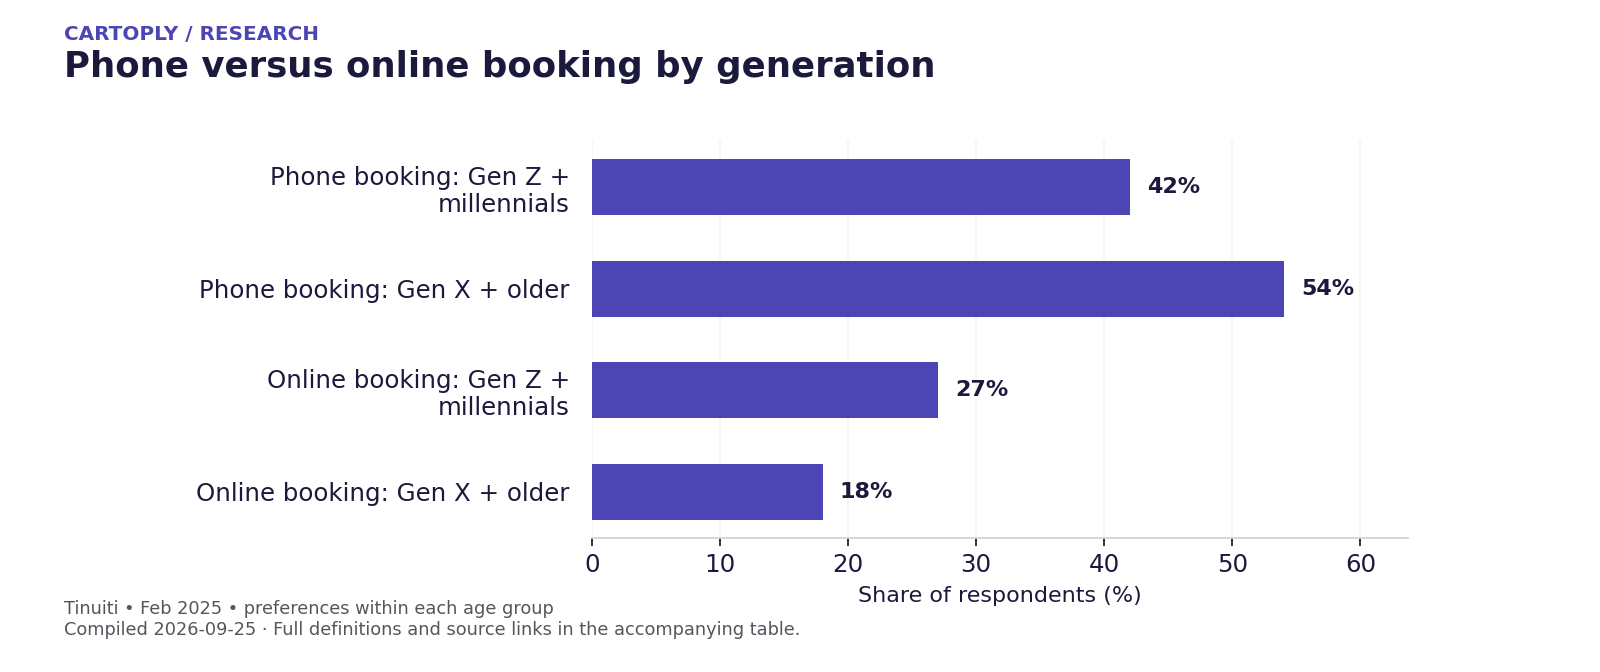
Tinuiti’s study distinguishes appointment booking from later communication. Keep the stage and age group attached when citing these figures.
U.S. homeowner survey; February 2025; n=1,000 overall. Subgroup sample sizes unspecified.
| Measure / group | Figure | Period / original source |
|---|---|---|
| Phone booking: Gen Z + millennials # | 42% | Feb 2025 Tinuiti |
| Phone booking: Gen X + older # | 54% | Feb 2025 Tinuiti |
| Online booking: Gen Z + millennials # | 27% | Feb 2025 Tinuiti |
| Online booking: Gen X + older # | 18% | Feb 2025 Tinuiti |
| Text preference for booking # | 9% | Feb 2025 Tinuiti |
| Text preference after booking # | 25% | Feb 2025 Tinuiti |
| Seasonal services: book a month ahead or earlier # | 28% | Feb 2025 Tinuiti |
How large is the plumbing and HVAC contractor industry?
The 2023 Census benchmark counts 111,207 paid-employee establishments in plumbing, heating and air-conditioning contracting across the United States. A business with several locations can have several establishments.
Paid-employee establishments in plumbing, heating and air-conditioning contracting (2017 NAICS 238220); all legal forms; all employee roles; excludes nonemployers. This industry includes commercial work as well as residential service.
| Measure / group | Figure | Period / original source |
|---|---|---|
| U.S. contractor establishments # | 111,207 establishments | 2023 U.S. Census Bureau (ZIP) |
| U.S. contractor industry employment # | 1,214,761 employees | 2023 U.S. Census Bureau (ZIP) |
Contractor establishments by state
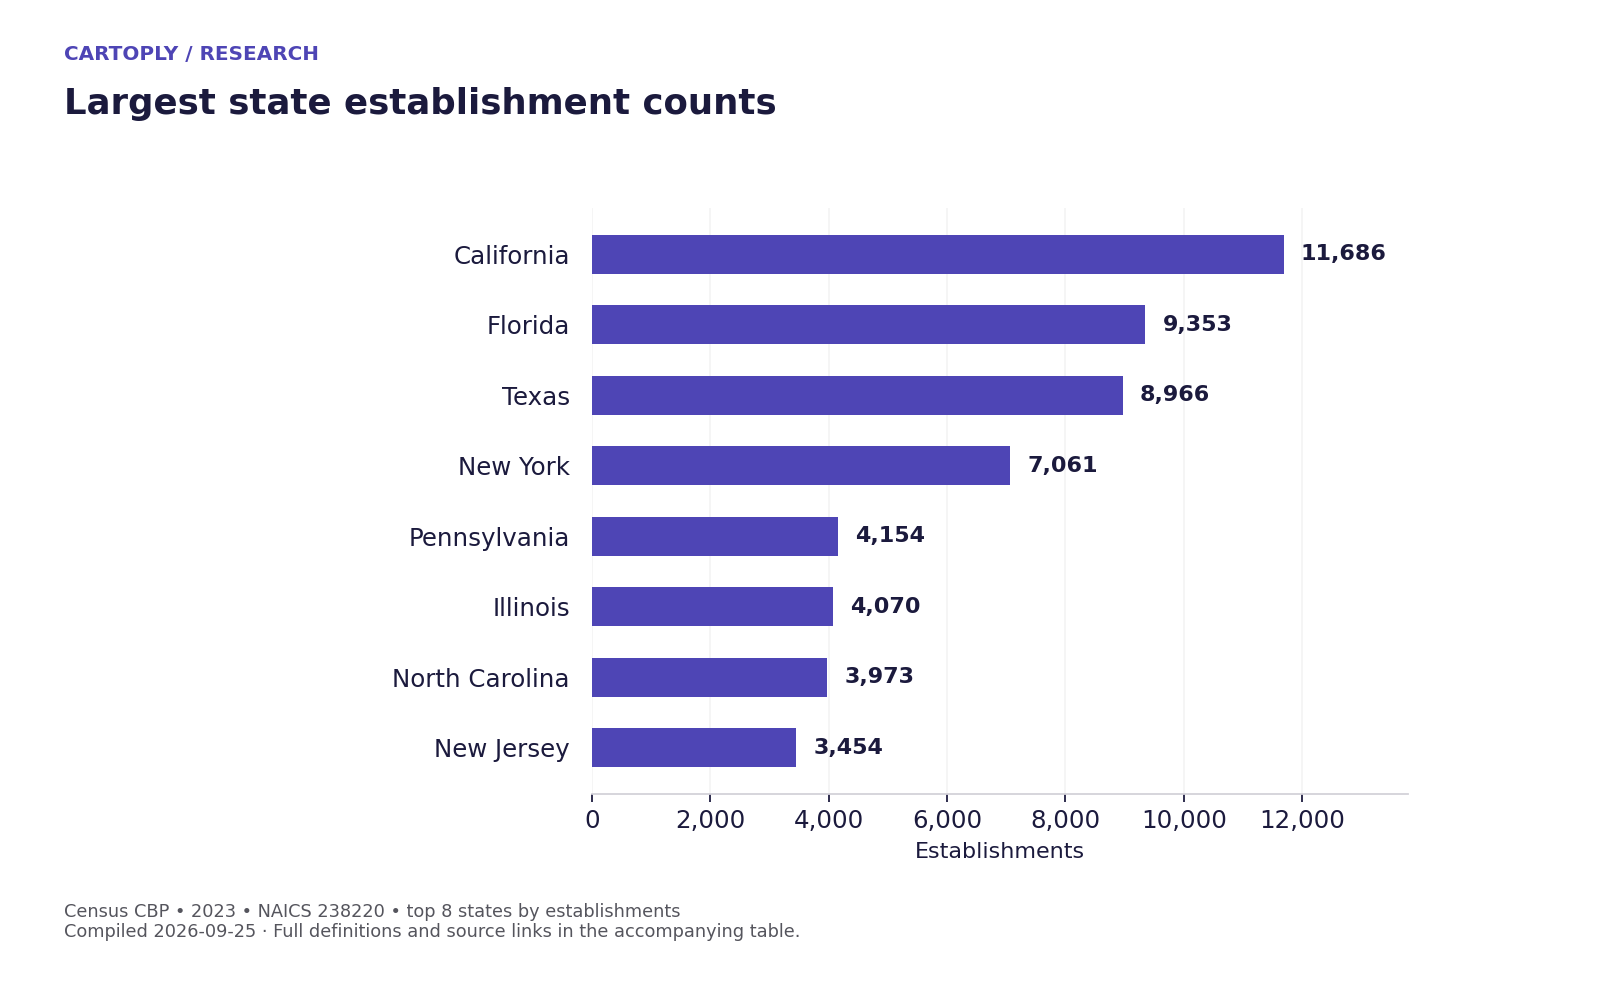
Use the state table as a starting point for market research. Establishment counts do not tell you how many businesses serve a particular ZIP code.
Paid-employee establishments in plumbing, heating and air-conditioning contracting (2017 NAICS 238220); all legal forms; all employee roles; excludes nonemployers. Data year: 2023.
| Measure / group | Figure | Period / original source |
|---|---|---|
| Alabama # | 1,647 establishments | 2023 U.S. Census Bureau (ZIP) |
| Alaska # | 264 establishments | 2023 U.S. Census Bureau (ZIP) |
| Arizona # | 2,567 establishments | 2023 U.S. Census Bureau (ZIP) |
| Arkansas # | 1,145 establishments | 2023 U.S. Census Bureau (ZIP) |
| California # | 11,686 establishments | 2023 U.S. Census Bureau (ZIP) |
| Colorado # | 2,620 establishments | 2023 U.S. Census Bureau (ZIP) |
| Connecticut # | 1,318 establishments | 2023 U.S. Census Bureau (ZIP) |
| Delaware # | 344 establishments | 2023 U.S. Census Bureau (ZIP) |
| District of Columbia # | 37 establishments | 2023 U.S. Census Bureau (ZIP) |
| Florida # | 9,353 establishments | 2023 U.S. Census Bureau (ZIP) |
| Georgia # | 3,101 establishments | 2023 U.S. Census Bureau (ZIP) |
| Hawaii # | 403 establishments | 2023 U.S. Census Bureau (ZIP) |
| Idaho # | 904 establishments | 2023 U.S. Census Bureau (ZIP) |
| Illinois # | 4,070 establishments | 2023 U.S. Census Bureau (ZIP) |
| Indiana # | 2,008 establishments | 2023 U.S. Census Bureau (ZIP) |
| Iowa # | 1,108 establishments | 2023 U.S. Census Bureau (ZIP) |
| Kansas # | 1,028 establishments | 2023 U.S. Census Bureau (ZIP) |
| Kentucky # | 1,379 establishments | 2023 U.S. Census Bureau (ZIP) |
| Louisiana # | 1,623 establishments | 2023 U.S. Census Bureau (ZIP) |
| Maine # | 781 establishments | 2023 U.S. Census Bureau (ZIP) |
| Maryland # | 1,986 establishments | 2023 U.S. Census Bureau (ZIP) |
| Massachusetts # | 3,069 establishments | 2023 U.S. Census Bureau (ZIP) |
| Michigan # | 2,661 establishments | 2023 U.S. Census Bureau (ZIP) |
| Minnesota # | 1,816 establishments | 2023 U.S. Census Bureau (ZIP) |
| Mississippi # | 709 establishments | 2023 U.S. Census Bureau (ZIP) |
| Missouri # | 1,915 establishments | 2023 U.S. Census Bureau (ZIP) |
| Montana # | 712 establishments | 2023 U.S. Census Bureau (ZIP) |
| Nebraska # | 837 establishments | 2023 U.S. Census Bureau (ZIP) |
| Nevada # | 909 establishments | 2023 U.S. Census Bureau (ZIP) |
| New Hampshire # | 776 establishments | 2023 U.S. Census Bureau (ZIP) |
| New Jersey # | 3,454 establishments | 2023 U.S. Census Bureau (ZIP) |
| New Mexico # | 691 establishments | 2023 U.S. Census Bureau (ZIP) |
| New York # | 7,061 establishments | 2023 U.S. Census Bureau (ZIP) |
| North Carolina # | 3,973 establishments | 2023 U.S. Census Bureau (ZIP) |
| North Dakota # | 336 establishments | 2023 U.S. Census Bureau (ZIP) |
| Ohio # | 2,970 establishments | 2023 U.S. Census Bureau (ZIP) |
| Oklahoma # | 1,592 establishments | 2023 U.S. Census Bureau (ZIP) |
| Oregon # | 1,337 establishments | 2023 U.S. Census Bureau (ZIP) |
| Pennsylvania # | 4,154 establishments | 2023 U.S. Census Bureau (ZIP) |
| Rhode Island # | 494 establishments | 2023 U.S. Census Bureau (ZIP) |
| South Carolina # | 1,685 establishments | 2023 U.S. Census Bureau (ZIP) |
| South Dakota # | 401 establishments | 2023 U.S. Census Bureau (ZIP) |
| Tennessee # | 1,899 establishments | 2023 U.S. Census Bureau (ZIP) |
| Texas # | 8,966 establishments | 2023 U.S. Census Bureau (ZIP) |
| Utah # | 1,443 establishments | 2023 U.S. Census Bureau (ZIP) |
| Vermont # | 303 establishments | 2023 U.S. Census Bureau (ZIP) |
| Virginia # | 2,765 establishments | 2023 U.S. Census Bureau (ZIP) |
| Washington # | 2,242 establishments | 2023 U.S. Census Bureau (ZIP) |
| West Virginia # | 406 establishments | 2023 U.S. Census Bureau (ZIP) |
| Wisconsin # | 1,944 establishments | 2023 U.S. Census Bureau (ZIP) |
| Wyoming # | 315 establishments | 2023 U.S. Census Bureau (ZIP) |
Contractor employment by state
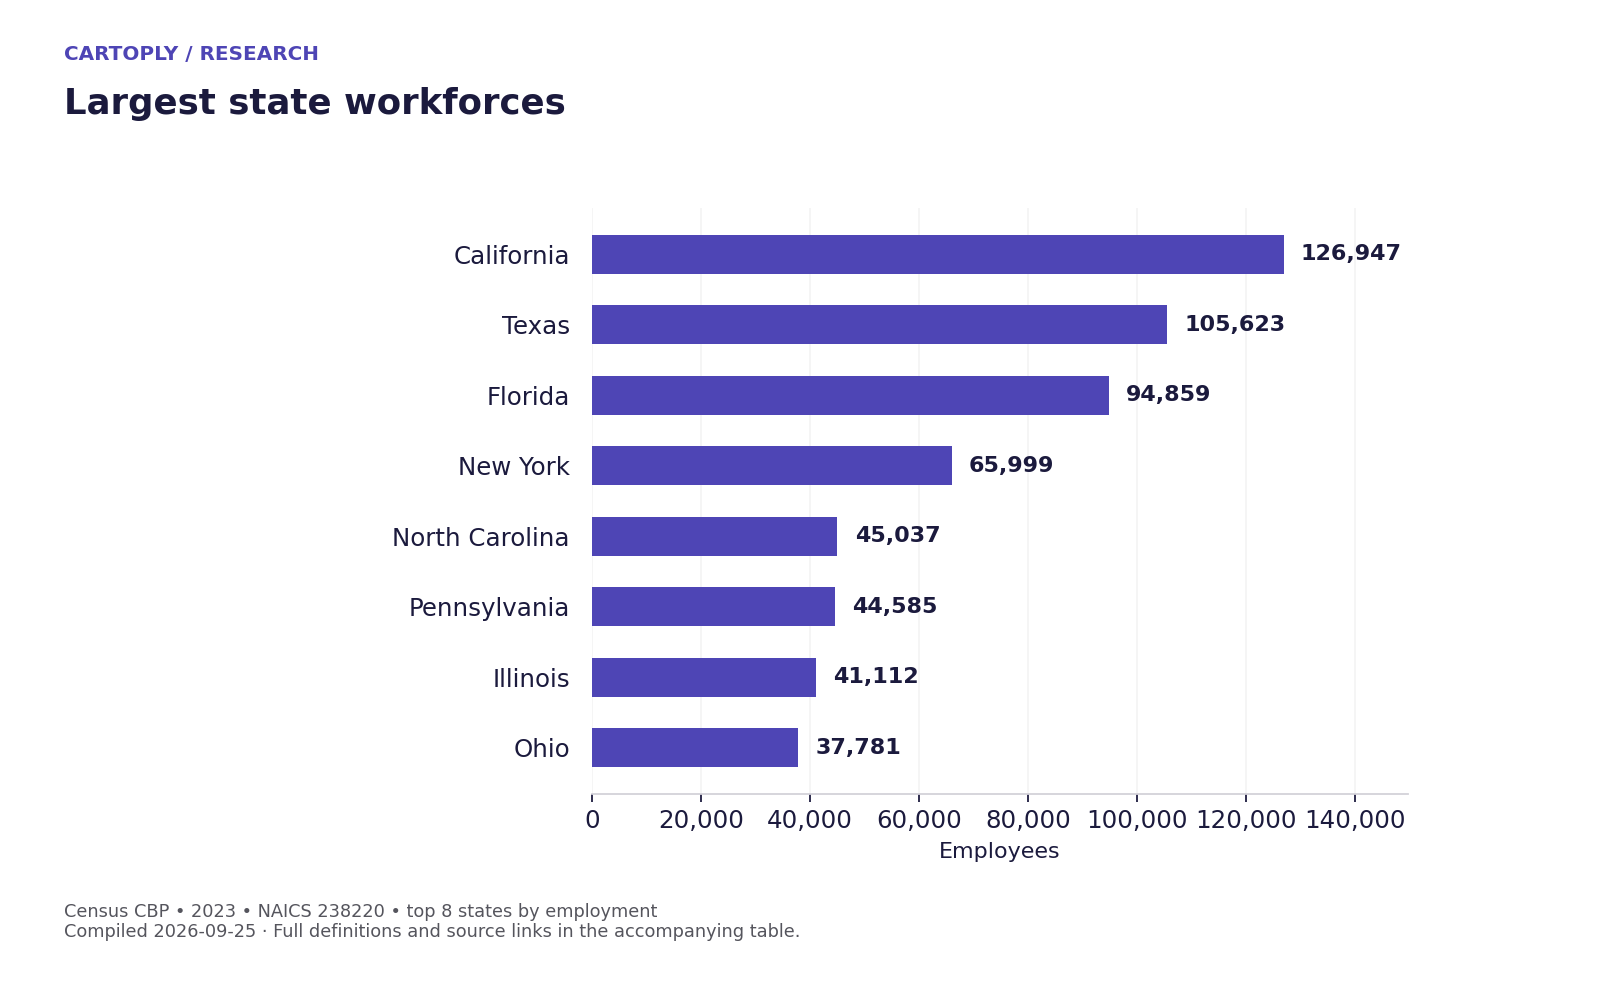
This is employment across the plumbing and HVAC contractor industry, including office and other roles. It does not measure the number of available technicians or open appointment slots.
Paid-employee establishments in plumbing, heating and air-conditioning contracting (2017 NAICS 238220); all legal forms; all employee roles; excludes nonemployers. Data year: 2023.
| Measure / group | Figure | Period / original source |
|---|---|---|
| Alabama # | 17,066 employees | 2023 U.S. Census Bureau (ZIP) |
| Alaska # | 1,939 employees | 2023 U.S. Census Bureau (ZIP) |
| Arizona # | 32,158 employees | 2023 U.S. Census Bureau (ZIP) |
| Arkansas # | 10,835 employees | 2023 U.S. Census Bureau (ZIP) |
| California # | 126,947 employees | 2023 U.S. Census Bureau (ZIP) |
| Colorado # | 24,178 employees | 2023 U.S. Census Bureau (ZIP) |
| Connecticut # | 10,964 employees | 2023 U.S. Census Bureau (ZIP) |
| Delaware # | 4,719 employees | 2023 U.S. Census Bureau (ZIP) |
| District of Columbia # | 1,772 employees | 2023 U.S. Census Bureau (ZIP) |
| Florida # | 94,859 employees | 2023 U.S. Census Bureau (ZIP) |
| Georgia # | 33,250 employees | 2023 U.S. Census Bureau (ZIP) |
| Hawaii # | 3,944 employees | 2023 U.S. Census Bureau (ZIP) |
| Idaho # | 9,912 employees | 2023 U.S. Census Bureau (ZIP) |
| Illinois # | 41,112 employees | 2023 U.S. Census Bureau (ZIP) |
| Indiana # | 26,484 employees | 2023 U.S. Census Bureau (ZIP) |
| Iowa # | 14,647 employees | 2023 U.S. Census Bureau (ZIP) |
| Kansas # | 11,412 employees | 2023 U.S. Census Bureau (ZIP) |
| Kentucky # | 15,837 employees | 2023 U.S. Census Bureau (ZIP) |
| Louisiana # | 14,032 employees | 2023 U.S. Census Bureau (ZIP) |
| Maine # | 4,783 employees | 2023 U.S. Census Bureau (ZIP) |
| Maryland # | 29,326 employees | 2023 U.S. Census Bureau (ZIP) |
| Massachusetts # | 29,674 employees | 2023 U.S. Census Bureau (ZIP) |
| Michigan # | 30,546 employees | 2023 U.S. Census Bureau (ZIP) |
| Minnesota # | 21,283 employees | 2023 U.S. Census Bureau (ZIP) |
| Mississippi # | 6,851 employees | 2023 U.S. Census Bureau (ZIP) |
| Missouri # | 23,628 employees | 2023 U.S. Census Bureau (ZIP) |
| Montana # | 4,448 employees | 2023 U.S. Census Bureau (ZIP) |
| Nebraska # | 9,947 employees | 2023 U.S. Census Bureau (ZIP) |
| Nevada # | 17,166 employees | 2023 U.S. Census Bureau (ZIP) |
| New Hampshire # | 5,608 employees | 2023 U.S. Census Bureau (ZIP) |
| New Jersey # | 30,302 employees | 2023 U.S. Census Bureau (ZIP) |
| New Mexico # | 6,612 employees | 2023 U.S. Census Bureau (ZIP) |
| New York # | 65,999 employees | 2023 U.S. Census Bureau (ZIP) |
| North Carolina # | 45,037 employees | 2023 U.S. Census Bureau (ZIP) |
| North Dakota # | 3,368 employees | 2023 U.S. Census Bureau (ZIP) |
| Ohio # | 37,781 employees | 2023 U.S. Census Bureau (ZIP) |
| Oklahoma # | 13,349 employees | 2023 U.S. Census Bureau (ZIP) |
| Oregon # | 15,676 employees | 2023 U.S. Census Bureau (ZIP) |
| Pennsylvania # | 44,585 employees | 2023 U.S. Census Bureau (ZIP) |
| Rhode Island # | 4,410 employees | 2023 U.S. Census Bureau (ZIP) |
| South Carolina # | 18,417 employees | 2023 U.S. Census Bureau (ZIP) |
| South Dakota # | 4,356 employees | 2023 U.S. Census Bureau (ZIP) |
| Tennessee # | 25,248 employees | 2023 U.S. Census Bureau (ZIP) |
| Texas # | 105,623 employees | 2023 U.S. Census Bureau (ZIP) |
| Utah # | 15,616 employees | 2023 U.S. Census Bureau (ZIP) |
| Vermont # | 2,390 employees | 2023 U.S. Census Bureau (ZIP) |
| Virginia # | 34,582 employees | 2023 U.S. Census Bureau (ZIP) |
| Washington # | 33,116 employees | 2023 U.S. Census Bureau (ZIP) |
| West Virginia # | 2,981 employees | 2023 U.S. Census Bureau (ZIP) |
| Wisconsin # | 23,507 employees | 2023 U.S. Census Bureau (ZIP) |
| Wyoming # | 2,479 employees | 2023 U.S. Census Bureau (ZIP) |
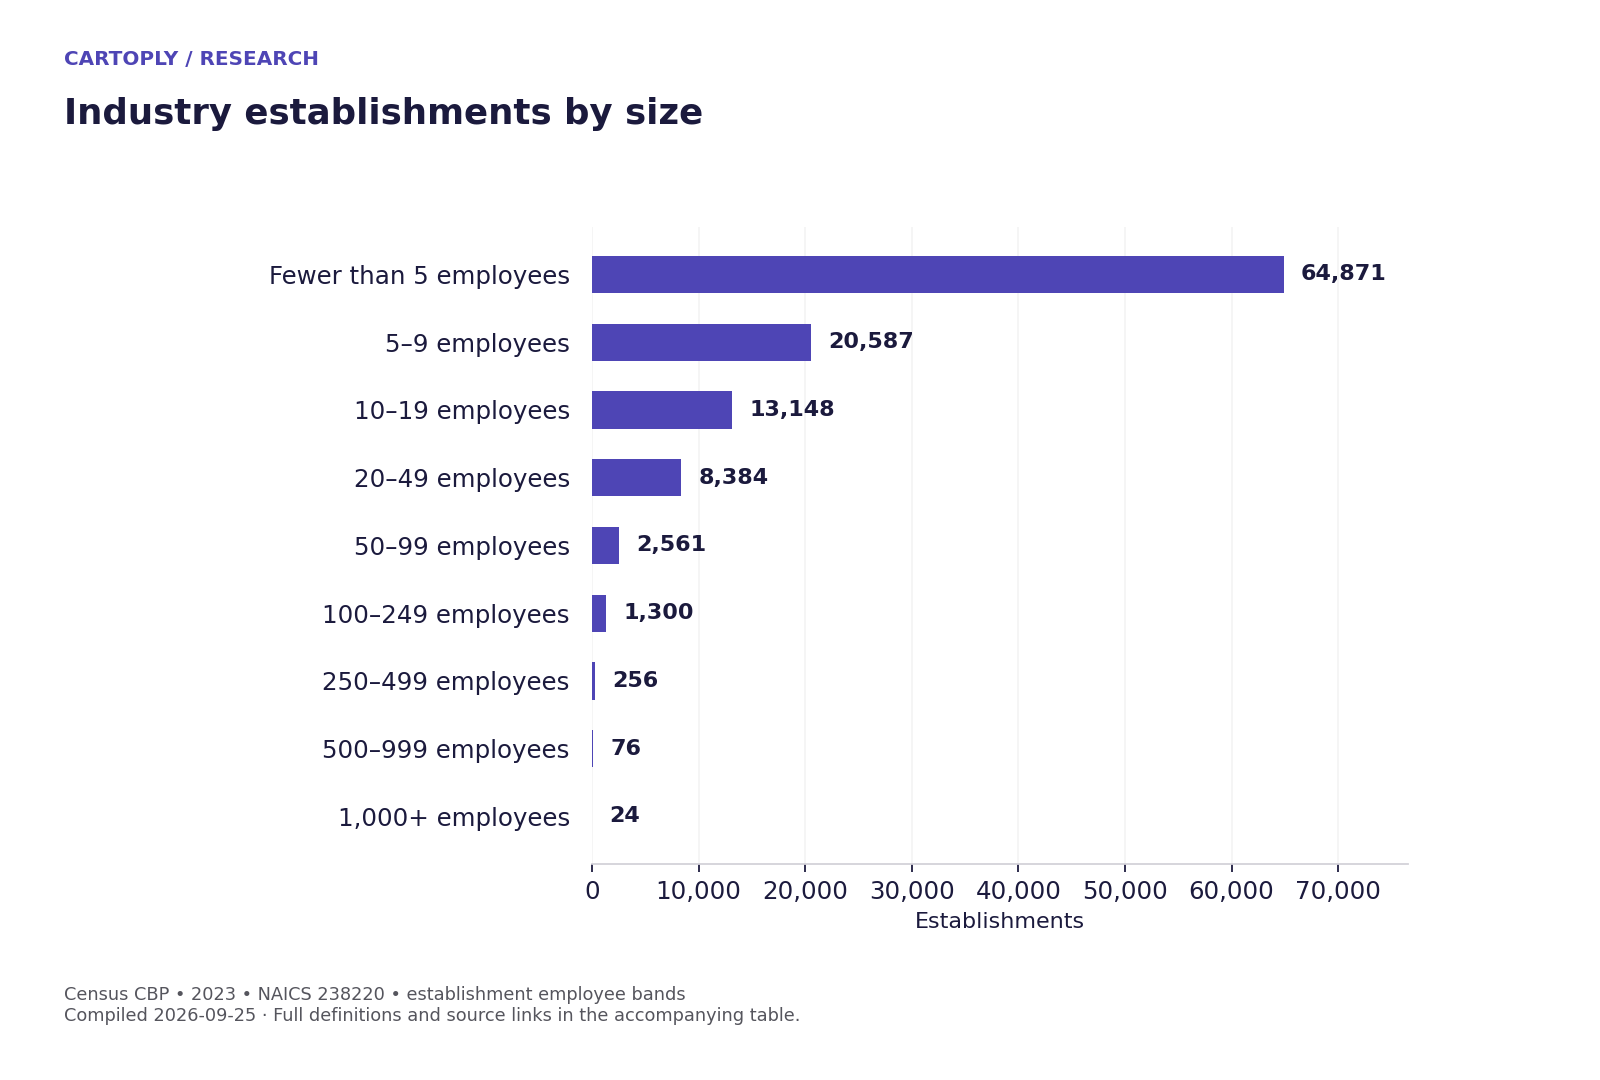
Contractor establishments by establishment size
Size classes refer to employment at each establishment. They do not describe the employee count of an entire multi-location company.
Paid-employee establishments in plumbing, heating and air-conditioning contracting (2017 NAICS 238220); all legal forms; all employee roles; excludes nonemployers. National totals; 2023.
| Measure / group | Figure | Period / original source |
|---|---|---|
| Fewer than 5 employees # | 64,871 establishments | 2023 U.S. Census Bureau (ZIP) |
| 5–9 employees # | 20,587 establishments | 2023 U.S. Census Bureau (ZIP) |
| 10–19 employees # | 13,148 establishments | 2023 U.S. Census Bureau (ZIP) |
| 20–49 employees # | 8,384 establishments | 2023 U.S. Census Bureau (ZIP) |
| 50–99 employees # | 2,561 establishments | 2023 U.S. Census Bureau (ZIP) |
| 100–249 employees # | 1,300 establishments | 2023 U.S. Census Bureau (ZIP) |
| 250–499 employees # | 256 establishments | 2023 U.S. Census Bureau (ZIP) |
| 500–999 employees # | 76 establishments | 2023 U.S. Census Bureau (ZIP) |
| 1,000+ employees # | 24 establishments | 2023 U.S. Census Bureau (ZIP) |
Methodology and source notes
This reference was compiled by Cartoply from original government data and publisher surveys. Cartoply did not conduct these surveys. Each distinct measure, population and period counts once. The charts and headline cards reuse existing entries.
What the state tables cover. Census NAICS 238220 combines plumbing, heating and air-conditioning contractors, including commercial work and all employee roles. Establishments are business locations with paid employees; they are not necessarily separate companies. Nonemployers are excluded. Employment is measured for the pay period including March 12, 2023.
What the state tables cannot tell you. A headcount does not measure technician availability, a company’s service area, driving time or customer demand. These are market benchmarks. Actual booking coverage depends on a team’s territories and calendar availability.
Census employment rows use the published low-noise flag G. No suppressed value is treated as zero. The vintage is explicitly 2023. See the 2023 data release and record definitions.
What the surveys mean. Preferences and self-reported experiences are not observed conversion rates. The homeowner and owner samples differ, so their percentages should not be combined. Modernize collected its 2025 responses during July–October. The report does not disclose a country breakdown; question-level sample sizes appear alongside the tables.
- U.S. Census Bureau — 2023 County Business Patterns: United States
Published or updated: 2025-06-26. Checked: 2026-09-25.
Paid-employee establishments in plumbing, heating and air-conditioning contracting (2017 NAICS 238220); all legal forms; all employee roles; excludes nonemployers. Employment is mid-March. Payroll is annual, reported in thousands of dollars. Disclosure noise applies.
- U.S. Census Bureau — 2023 County Business Patterns: states and DC
Published or updated: 2025-06-26. Checked: 2026-09-25.
Paid-employee establishments in plumbing, heating and air-conditioning contracting (2017 NAICS 238220); all legal forms; all employee roles; excludes nonemployers. Employment is mid-March. Payroll is annual, reported in thousands of dollars. Disclosure noise applies.
- Jobber — 2026 Home Service Trends Report
Published or updated: 2026 report; day not stated. Checked: 2026-09-25.
Conjointly surveyed 1,050 U.S. home-service owners in December 2025. Self-reports; subgroup sample sizes unspecified.
- Jobber — Recent Homebuyer Reality Check
Published or updated: 2026 report; day not stated. Checked: 2026-09-25.
Coleman Parkes, May 2026: 800 U.S. single-family homebuyers from the preceding two years, equally split across four generations.
- Modernize — 2025 Homeowner Insights Report
Published or updated: 2025 report; day not stated. Checked: 2026-09-25.
Home-improvement audience surveyed July–October 2025 (PDF page 4). Each question has its own response count; probability sampling and country breakdown are not disclosed.
- Tinuiti — 2025 Home Services Marketing Study
Published or updated: 2025 study; day not stated. Checked: 2026-09-25.
Survey of 1,000 U.S. homeowners, February 2025. Subgroup sample sizes unspecified; preferences are self-reported.
All source links were opened during compilation; the government ZIP files and Modernize PDF were downloaded and inspected. The evidence ledger records source locations and retrieval notes. Next editorial review is targeted for December 15, 2026; dates advance only after a fresh source review.
How to cite this hub
Carry the original publisher, population and data year with each number. Cite the original study for its finding, and this hub when referencing the compiled comparison or state directory.
Cartoply. 138 Home-Service Booking & Contractor Statistics. September 25, 2026.
https://www.cartoply.com/statistics/home-service-booking-statisticsFrom a market benchmark to a bookable territory
Define where each person actually works, then set the hours they can accept bookings. Read about territory routing and availability controls before changing your booking flow.
Put your service area on the map
Draw the areas your team covers with Cartoply’s free territory map builder.
Build a territory map →